Introduction
There is growing bipartisan consensus that the US should pursue occupational licensing reform. Both the Obama administration and members of the Trump administration, such as Secretary of Labor Alexander Acosta, have indicated support for states to pursue reform. The effects of occupational licensing on the price of services and the wages of professionals has been well documented. Estimates suggest that licensed occupations experiencing 10% employment growth from 1990 to 2000 would have had employment growth of 12% without occupational licensing in place. A new NBER working paper estimates that state-specific licensing exams may reduce interstate migration by 36%–potentially resulting in workers experiencing “job lock.”
What is less understood is how licensing affects economic mobility. In other words, is occupational licensing preventing individuals from earning more than their parents? In a previous paper published by the Archbridge Institute, we introduced a new data set that documents growth in occupational licensing of low- and moderate-income occupations from 1993 to 2012. Matching this newly produced data with data from The Equality of Opportunity Project, we found evidence of a potential negative correlation between growth in licensed occupations and absolute economic mobility.
Occupational licensing laws require individuals to complete mandatory entrance requirements before they are able to begin a new profession. Entrance requirements may include minimum levels of schooling or training, fees, or more subjective tests such as possessing “good moral character.” Although state occupational licensing requirements may be perceived to be protecting the public from receiving poor quality service or being deceived by charlatan “fly-by-night” thieves, there are compelling arguments that can be made that licensing today is going too far. As a recent example, a New York Times article documents that in 19 states, individuals may have their professional license seized if they default on student loans. It is not clear how failure to pay student loans correlates with the professional’s ability to competently perform their trade or profession.
At the national level, growth in occupational licensing has been well documented. The percentage of workers directly affected by occupational licensing has grown by at least 17 percentage points over the last 60 years. At the state level, historical trends are not as well known. The Institute for Justice has published two editions of their landmark study License to Work—providing snapshots of occupational licensing requirements for 102 low-and moderate-income occupations in 2012 and 2017. Another recent study by Kleiner and Vorotnikov provides estimates of the percentage of workers licensed in each state ranging from 12.4% in South Carolina to 33.3% in Iowa.
As indicated previously, the stated intent of occupational licensing laws is to protect the public from harm and to make sure that quality standards are set at a bare minimum. But how can we justify occupational licensing of florists in Louisiana when no other state has a similar requirement? Or why interior designers in Louisiana as well as Florida, Nevada, and the District of Columbia have to complete 6 years of education to obtain a license?
In addition to potentially raising the price of services for consumers, these and other examples of seemingly needless occupational licensing laws may be reducing job opportunities for America’s poor and middle class. Requiring aspiring interior designers and florists to pay fees and complete years of education may be unattainable for many Americans. For this reason, we hypothesize that occupational licensing may be restricting economic mobility.
This potential restraint on mobility could also affect entrepreneurial ventures by people trying to enter these professions on their own. As indicated by Meehan (2015) increases in occupational licensing requirements for individual private security guards and firms reduced the number of firms and increased the size of existing licensed firms. Thus, the efforts of low and moderate-income entrepreneurs may be hampered by these licenses, and potential increases in competition and superior service provision that often come with increased entrepreneurial activity may be limited. The relationship between the growth in licensed occupations and absolute mobility provides suggestive evidence of this loss in opportunity and reduced entrepreneurship for these occupations. Survey evidence of entrepreneurs from Jensen (2016) indicates that among licensed business, which have survived more than 5 years, occupational licensing burdens ranked ahead of availability of capital as more burdensome requirements for continuing operation.
In the sections that follow, we assess and analyze how occupational licensing may be restricting opportunities in the US. Our paper proceeds by:
- Providing state-by-state estimates of growth in low- and moderate-income occupations from 1992 to 2012. An update is also provided for 2017. State profiles (sorted both by state and occupation) are provided as an appendix.
- Estimating the effect that growth in occupational licensing has had on absolute economic mobility. Evaluating at mean levels of economic mobility, our empirical results suggest growth in state licensing is associated with a 1.7% to 6.7% reduction in absolute mobility at the county level.
- Estimating the effect that growth in occupational licensing has had on income inequality. Evaluating at mean levels of income inequality, growth in licensing is also associated with increases in county level Gini coefficients (and thus income inequality) ranging from 3.9% to 15.4%.
State Growth in Occupational Licensing
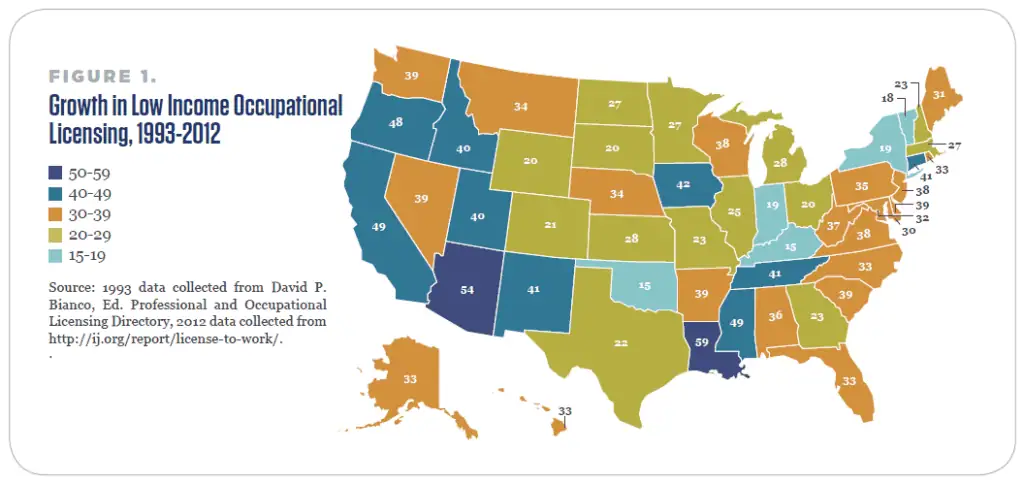
Growth in occupational licensing over the 1993-2012 period has been widespread in the United States, with states on average increasing the number of low-income professions licensed by 31 over this 20-year period (see Table 1). As shown in Figure 1, however, heterogeneity in licensing growth exists across the United States. Louisiana, for instance, had the largest increase in United States—59 newly licensed low-income occupations. Oklahoma and Kentucky on the other hand, experienced the lowest growth of only 15 newly licensed low-income occupations. Further examination of the states suggests that these disparities do not appear to be geographically related. In the South, Tennessee licensed 41 new low-income occupations, but bordering state Kentucky licensed only 15 occupations. In New England, Connecticut licensed 41 new low-income occupations and Vermont licensed just 18 new occupations.
As a new addition for this manuscript, we have produced partial lists of newly licensed low-income occupations from 1993 to 2012 in each state. Appendix 1 sorts the occupations by state and appendix 2 by occupation. Massage therapists serve as a good example of growth in low-income occupations. 26 states and the District of Columbia added licensing requirements between 1993 and 2012. Research suggests that adding licensing requirements increased the earnings of massage therapists by more than 16%. By increasing the costs associated with entering the profession, licensing may allow massage therapists to charge higher prices as a result of facing less competition in the market place. In addition, aspiring massage therapists may be discouraged from entering the profession and this may potentially result in reductions in economic mobility and increases in income inequality.
As a contrast, not a single state added licensing requirements for opticians over this same time period. From a public policy perspective, it is not clear why some states regulate the same occupation much more onerously than others. From a research perspective, the political economy of the evolution of new licensing laws remains an understudied topic.
In November of 2017, the Institute for Justice published a new edition of their landmark study License to Work. By comparing the two volumes, we can explore more recent changes in the growth of occupational licensing. The particular occupations collected and methodology for the updated report changed slightly, which limits direct comparisons of aggregate state level occupations licensed between the two reports. Comparisons of particular occupations collected in both 2012 and 2017, however, illuminate a continuing trend for licensure across the U.S. Alabama added new licensing requirements for barbers in 2013—the profession was not subject to statewide licensing since 1983. Four states (Alaska, Hawaii, Maryland, and West Virginia) added licensing requirements for athletic trainers. These are just two examples among many newly licensed occupations over a 5-year period. Modest reform in the opposite direction has occurred for one occupation—the 2017 report indicates that 23 states have exempted hair braiders from acquiring cosmetology and/or barber licenses. More than half (14) have deregulated hair braiding since 2014. Research suggests that deregulation of hair braiding in Virginia led to new opportunities for entrepreneurs in the state. Although this type of reform is promising, the licensing changes for occupations like athletic trainers and barbers are more indicative of the overall trend.
Estimates of the Effect of Licensing Growth on Economic Mobility
As indicated above, the data pertaining to licensing growth were obtained by comparing professions licensed in each state for 1993 and again for 2012. These data were then combined with existing cross-county data made available through The Equality of Opportunity Project, originally published in The Quarterly Journal of Economics by Chetty, Hendren, Kline, and Saez. The main dependent variable for our empirical analysis is the absolute upward mobility measure from this paper. This measure estimates the expected rank of children in each county in the middle of the lower half of the income distribution. In other words, families at the 25th percentile of the income distribution.
In each county, this estimate captures the expected (average) income rank of a child whose parents are at the 25th percentile of the income distribution. The 25th percentile of the income distribution was selected as the primary measure of interest in the Chetty et al. paper, and is of interest to this analysis, because it captures the chances of an individual raised in a relatively low-income family of moving up the income distribution relative to their family circumstances. As such, the estimate is centered on the absolute income mobility of the children of low or moderate-income families. In this way, this measure captures the change in mobility or the opportunity to move up in income distribution from generation to generation over the period of interest.
The data gathered from the Chetty et al. study are county level and were estimated using 1980–82 birth cohorts and are the latest birth cohorts used in the study. They take into account the income percentile of parents and their children. The children born between 1980 and 1982 should be reaching some of their prime work years in 2012. While the estimate is a cross-sectional statistic for each county it does capture the income earning dynamics across two generations. This statistic could be influenced by the licensing growth statistics over the 1993-2012 period, which are also focused on low and moderate-income occupations.
Occupational licensing is done at both the state and local level in the U.S. Unfortunately, statistics on changes to local level occupations licensed for these 102 low- to moderate- income occupations are not available. Consequently, the analysis is limited to changes in low-income licensed occupations at the state level, while the absolute upward mobility data are county level statistics. We record the state level change in licensing for each county within a state. We also examine the relationship between occupational licensing and county level inequality using a county level Gini coefficient which was also included in the Chetty et al. dataset.
The Gini coefficient is a very common measure of income inequality and is defined by the U.S. Census as follows: “The Gini index, or index of income concentration, is a statistical measure of income inequality ranging from 0 to 1. A measure of 1 indicates perfect inequality, i.e., one household having all the income and rest having none. A measure of 0 indicates perfect equality, i.e., all households having an equal share of income.” As this number increases, measured income inequality also increases. Ideally, we would measure the change in the county level Gini Coefficient over the 1993-2012 period, but we do not have access to the 1993 data. We therefore rely on the 2012 data for our analysis. The empirical models are county level cross sectional OLS models and are estimated as follows:

is the change in low- and moderate-income occupations in state j requiring a license from 1993 through 2012. is a vector of county level (subscript i) demographic controls which includes county level income and population measures for 2012, as well as county level changes in real ($2012) income per capita over the period of interest (1993-2012), and the percentage of children born to teenage mothers. is the idiosyncratic error. Standard errors were clustered by state commuting zone ids, as errors may be correlated within geographic areas; each commuting zone includes multiple counties. Unemployment rates are not included as a control as they are likely closely related to changes in occupational licensing. Occupational licensing limits entry and controls the pool of job seekers; it has the potential to have impacts on unemployment within those industries. As the number of occupations licensed increases the more likely this change is to have impacts on the aggregate unemployment rate within a county. In a 2016 Brookings policy paper, Ryan Nunn documents the close relationship between unemployment and licensed professions. As indicated by Nunn:
Licensing creates “crowding” in unlicensed occupations and labor scarcity in licensed occupations driving a wedge between the unemployment rates in the two sectors.
Licensing may also be closely related to average income per capita measures. Licensing may limit entry into a profession and reduce the potential earnings of those attempting to enter that profession. Licensing may also increase the earnings of those fortunate enough to obtain licenses. In this way, the relationship between licensing growth and per capita income is ambiguous. As a result, we elect to include it as a control variable in the analysis.
Given the cross-sectional nature of the data these relationships should be taken as suggestive, no claims of causation are made. This analysis also deals with the growth in licensing, not the stringency of licensing requirements. Substantial changes to the requirements needed to acquire licenses has also changed over time. Examples of these requirements include experience requirements, training, and exam requirements to acquire licenses. This analysis does not focus on these changes but instead on the change in the number of occupations licensed. Table 1 gives the summary statistics for these data, and Table 2 presents the estimation results.
| Table 1: Summary Statistics | ||
| Mean | Standard Deviation | |
| State Level Change in Low Income Licensed Occupations | 31.04 | 10.37 |
| 2012 Population | 100732.1 | 322070.8 |
| 2012 Income Per Capita | 37700.9 | 10823.5 |
| 1993-2012 Change in Income Per Capita | 20147.53 | 8547.241 |
| Teenage Birth Rate | 16.5265 | 5.7815 |
| Absolute Upward Mobility | 43.4408 | 5.4513 |
| County Level Gini Coefficient | 0.3838 | 0.0861 |
| Table 2: Relationship Between Low Income Licensed Occupations, Absolute Upward Mobility, and County Level Gini Coefficients. | ||
| (1) Absolute Upward Mobility | (2) Gini Coefficient | |
| Change in Low Income Licensed Occupations | -0.049*** (0.0114) | 0.0010*** (0.0002) |
| 2012 Population | 0.00001** (0.0000) | 0.0000001*** (0.0000) |
| 2012 Income Per Capita | -0.0006*** (0.0000) | 0.00001*** (0.0000) |
| 1993-2012 Change in Income Per Capita | 0.0009*** (0.0000) | -0.00001*** (0.0000) |
| Teenage Birth Rate | -0.5645*** (0.03201) | 0.0084*** (0.004) |
| Intercept | 58.9942 | 0.0694 |
| N | 2,717 | 2,717 |
| R2 | 0.4975 | 0.3163 |
| Clustered Robust Standard errors in parentheses. * p < .10, ** p < .05, *** p < .01 |
As indicated by Table 2 increases in occupational licensing are associated with reductions in absolute upward mobility and increases in county Gini coefficients. This suggestive relationship provides some evidence that increases in licensing of low income occupations may hamper mobility and increase income inequality.
In estimation (1) the coefficient (-0.049) is an estimate of the reduction in absolute economic mobility associated with a state adding licensing requirements for one low- or moderate-income occupation. The most extreme growth in low income licensed occupations occurred in Louisiana, which licensed 59 more occupations in 2012 than in 1993. Our estimated coefficient suggests that Louisiana’s growth in licensing is associated with a 2.9 unit reduction in the absolute upward mobility figure. Evaluating this figure at the mean level of absolute upward mobility from Figure 1, his corresponds with a 6.7% reduction in absolute mobility. Such a reduction in absolute economic mobility indicates corresponding reductions in the expected income percentile that a person born into the 25th percentile income quartile would expect to be at as an adult—hence, less chance of achieving the American dream.
Using the sample mean growth in low- and moderate-income licensed occupations (31.04) as opposed to Louisiana’s change (59), yields an associated 3.5% reduction in the absolute mobility figure. Percentage change is again calculated using the sample mean of the absolute mobility figure. At the other extreme, Oklahoma and Kentucky had the smallest changes in the number of occupations licensed–just 15. A change of this magnitude is associated with a 1.7% reduction in the absolute mobility figure.
In summary, growth in the number of low- and moderate-income licensed occupations is associated with a reduction in absolute economic mobility ranging from as low as 1.7% in Oklahoma to as much as a 6.7% reduction in Louisiana. On average, economic mobility declined by 3.5% as the number of low- and moderate-income occupations grew from 1993 to 2012.
We now turn our attention to column (2) of Table 2. In this calculation we estimate the effect that growth in licensing has had on income inequality measured using county level Gini coefficient. In column (2) the coefficient (0.001) is an estimate of how much the Gini coefficient increases when a state adds licensing requirements for one low- or moderate-income occupation. If we compare Louisiana and Oklahoma, following a similar technique as above, we find that Louisiana’s county level Gini coefficient increased 0.059 units or by 15.4% increase (evaluated at the mean in Table 1). Oklahoma, by contrast, experienced a 3.9% increase in its Gini coefficient. If we evaluate the effect using the average change in licensed occupations (31.04), we estimate an 8.1% increase in the Gini coefficient. To summarize, growth in the number of low- and moderate-income occupations from 1993 to 2012 is associated with a 3.9% (Oklahoma) to 15.4% (Louisiana) increase in income inequality. It should be noted that national estimates of the increase in the Gini coefficient from 1992 to 1993 is approximately 10.2% or 4 Gini points.
Conclusion
This study provides an important contribution to the literature on U.S. absolute economic mobility and income inequality. The potential of occupational licensing to influence labor opportunities, economic mobility, and income distribution outcomes has been mostly unexplored up to this point in this literature. Our analysis builds on the pioneering work of Chetty et al. and the Institute for Justice. We should note that the nature of the data (cross sectional) limits our ability to perform causal inference. In other words, we cannot say that growth in licensing caused reductions in economic mobility or increases in income inequality. Instead, the findings of this paper shed light on a suggestive relationship between the growth of occupational licensing, the economic mobility of low income Americans, and income inequality. More specifically, our analysis suggests that growth in occupational licensing of low- and moderate-income occupations may be limiting opportunities for upward economic mobility (a 1.7% to 6.7% reduction evaluated at the mean). Licensing shrinks the pool of potential laborers by creating barriers to entry and this reduction in mobility also seems to relate to increases in income inequality (3.9% to 15.4% evaluated at the mean) as measured by U.S. county level Gini coefficients.
Future research on the dynamic components of the simple relationships outlined by this paper are needed. The distributional impacts of policy is an important component of any good public policy analysis. Occupation licensing policy has been a growing phenomenon over the past few decades in the U.S. Policy makers should take note of the potential distributional consequences of this growing phenomenon as they reconsider occupational licensing requirements for low- and moderate-income occupations. In addition to raising prices for consumers, occupational licensing may be creating barriers to opportunity that prevent the least fortunate Americans from achieving the American dream of prosperity.
Appendix 3 — Estimated Impact of Licensing Growth by State
Edward Timmons, PhD, is a senior fellow at the Archbridge Institute. He formerly served as founding director of the Knee Regulatory Research Center at West Virginia University. He is regularly asked to provide expert testimony in state legislatures across the U.S. on occupational licensing reform and the practice authority of nurse practitioners. His work is heavily cited by the popular press, and he has authored numerous articles for media publications.
