Overview
When people think of the American Dream, they consider the ability to better one’s life and achieve one’s goals. They are either directly or indirectly speaking about social mobility. In this index, we examine differences across the 50 states in providing an environment where citizens can pursue and reach their individual dreams, through the lens of social mobility.
What is social mobility? Social mobility is the opportunity to better oneself and those around them. While it commonly refers to a person’s ability to climb the income ladder and outearn the previous generation, social mobility is also concerned with achievement, aspirations, purpose, and skills development.
Social Mobility in the 50 States: In this index, we rank all fifty US states from best (#1) to worst (#50) based on their overall score for social mobility. Higher scores represent a better environment for social mobility and a better rank.
Four Pillars of Social Mobility: To rank each state, we measured a series of indicators related to social mobility across four pillars: Entrepreneurship and Growth, Institutions and the Rule of Law, Education and Skills Development, and Social Capital. Scores for each pillar were combined and weighted equally to create a state’s overall social mobility score.
Barriers to Social Mobility: People face barriers to social mobility across their lifespans. Artificial barriers are imposed by external forces and can be addressed with public policy, while natural barriers occur at the individual level and often require different interventions. One of the main objectives of this index is to generate a satisfactory taxonomy on the main barriers and leading indicators of social mobility.
Comparisons to Other Measures: We present evidence that our index correlates strongly with other measures of income mobility, income inequality, and poverty.
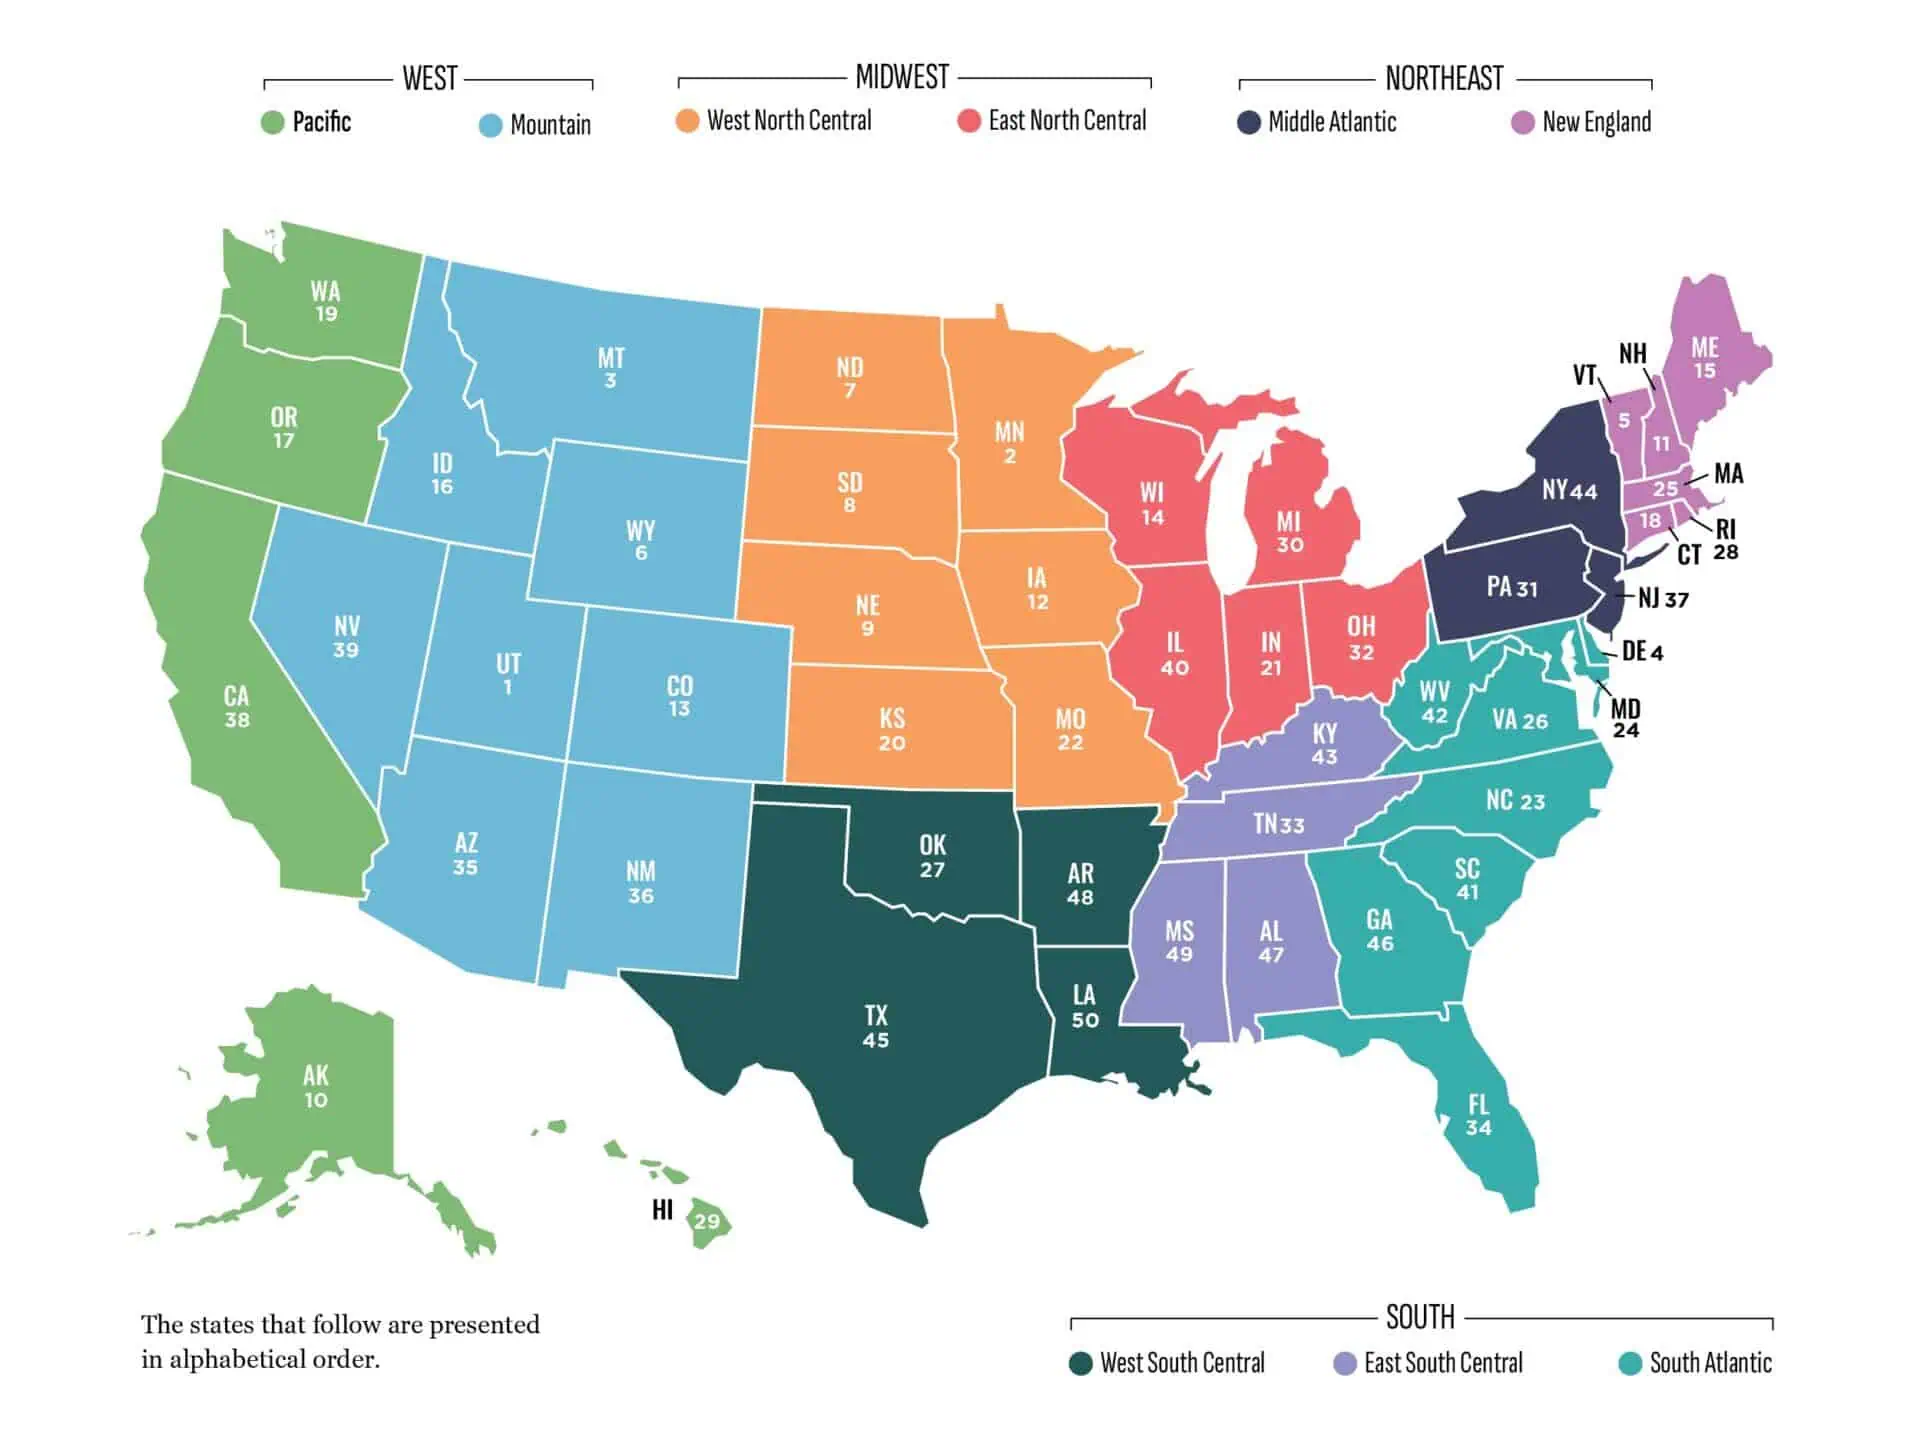
In 2023, the state with the best environment for social mobility is Utah (#1); the state with the worst social mobility outlook is Louisiana (#50). Additionally, states in the Mountain and West North Central regions generally perform well, while states in the South have higher barriers to social mobility.
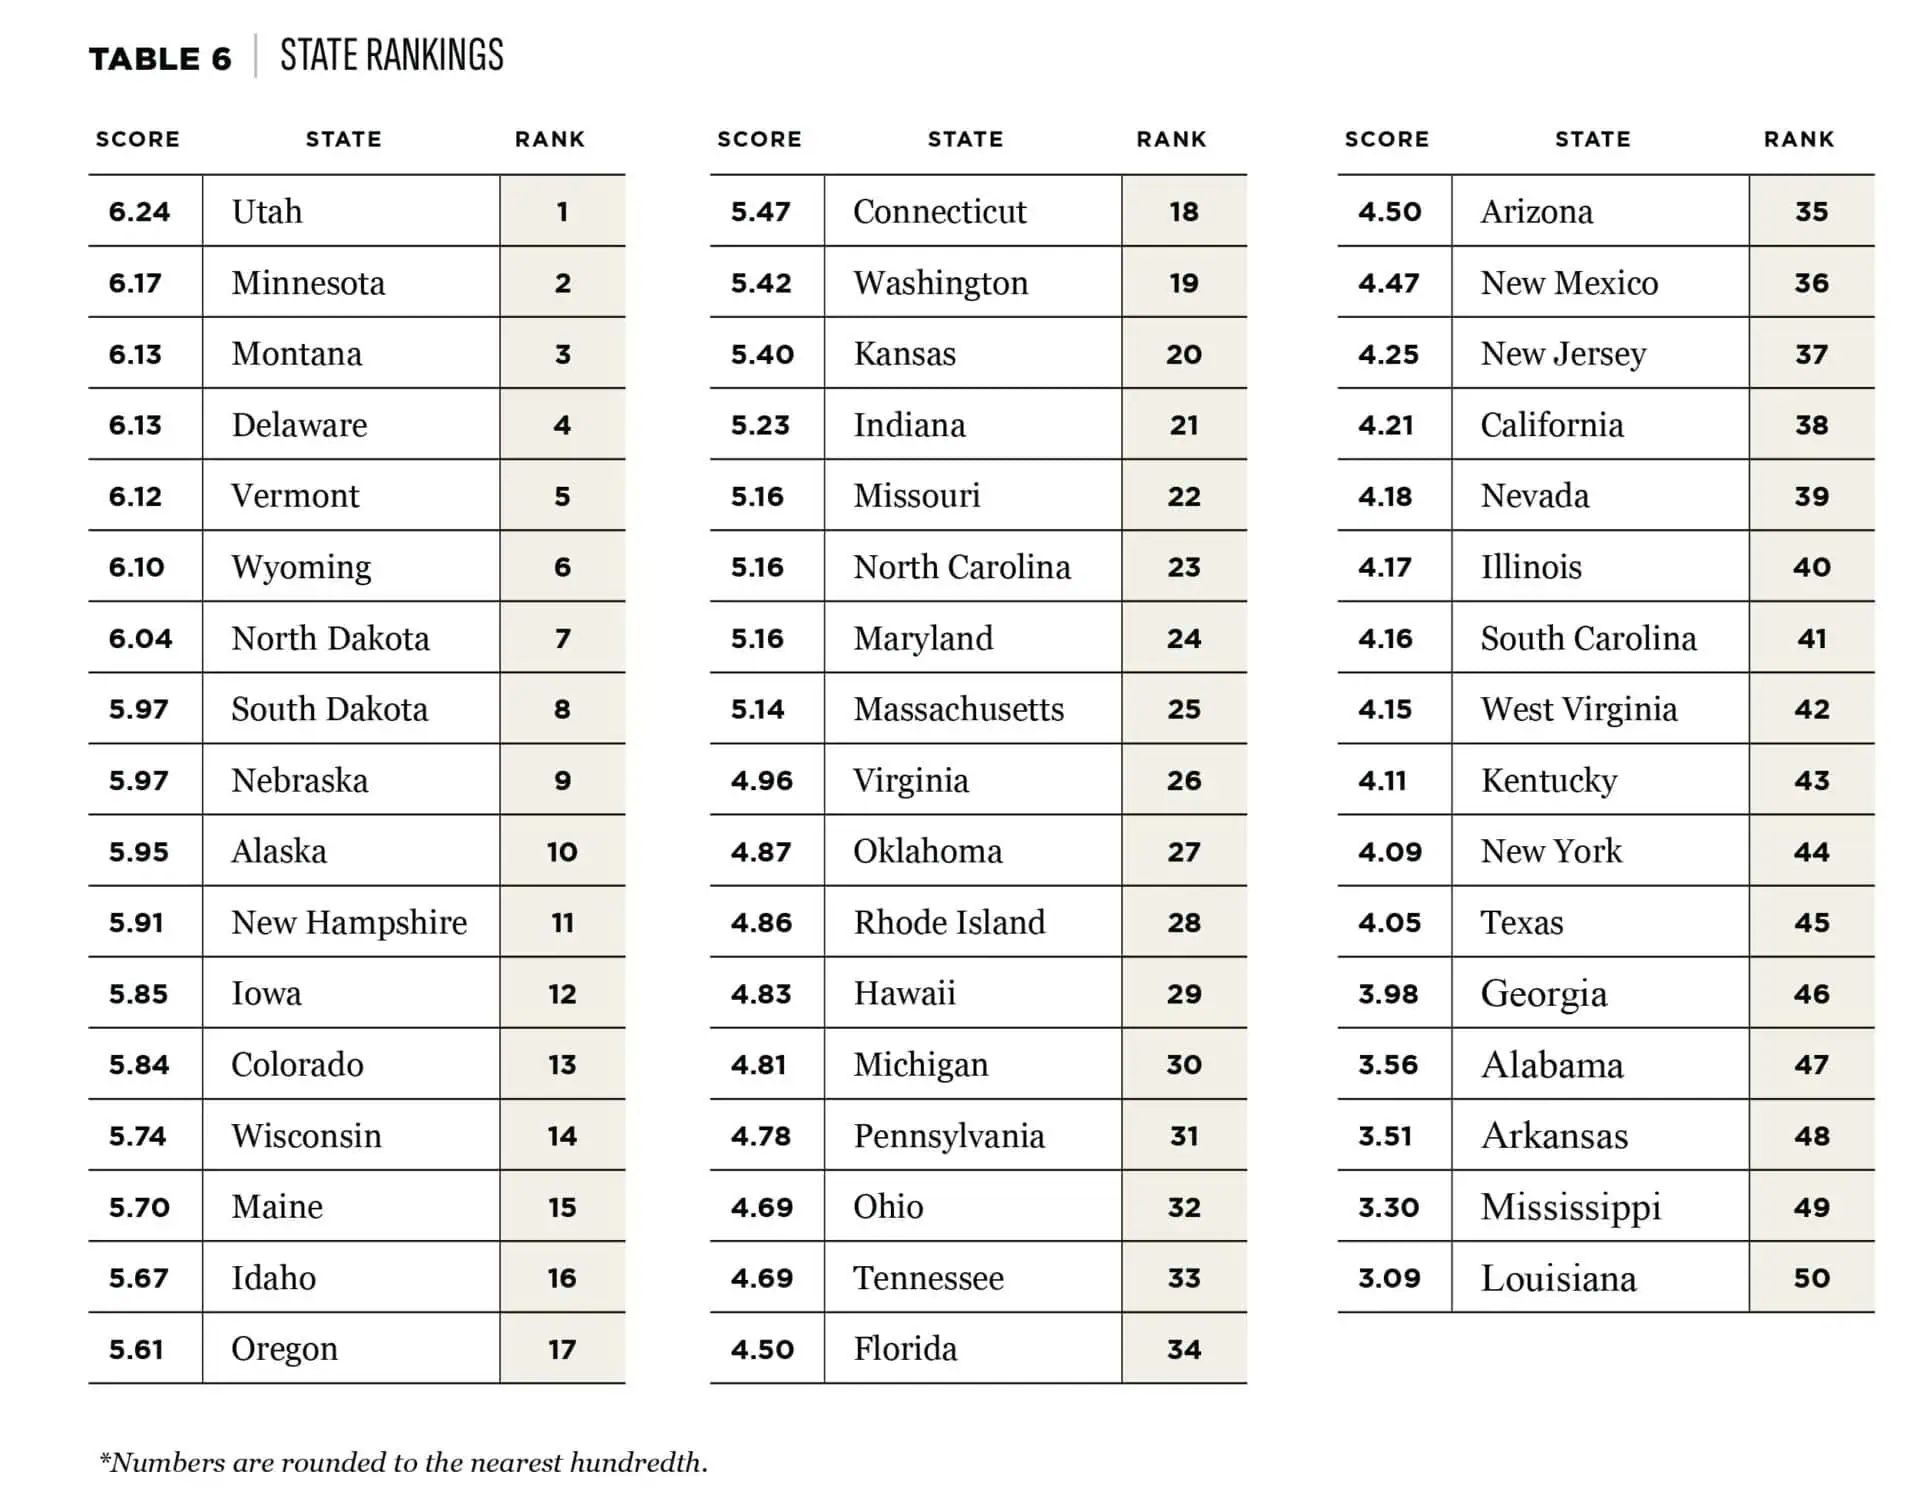
Each state profile features a breakdown of its overall and individual scores, a regional comparison, and key findings. This information provides useful insights for researchers and policymakers.
From the Authors:
The first step toward reform is recognition of where we are today, and Archbridge’s new report will help policymakers—at all levels of government—understand social mobility like never before. Defining social mobility based on four key pillars, our research team has spent many months analyzing all 50 U.S. states, identifying opportunities for growth in the best- and worst-performing states.
– Gonzalo Schwarz, President & CEO of the Archbridge Institute and co-author of Social Mobility in the 50 States
From Utah to Louisiana, we are proud to share the most comprehensive snapshot of opportunity in America to date, and we hope that it will lead to positive, lasting change for millions of Americans. The time for reform is now.
– Justin Callais, lead author of Social Mobility in the 50 States


