Introduction
Is the American Dream still alive? Researchers at the Equality of Opportunity Project produced a new data set tracking economic mobility and note that the percentage of children earning more than their parents has fallen from more than 90% for children born in the 1940s to 50% for children born in the 1980s. A recent report from the Archbridge Institute, however, notes that the picture may not be so bleak. Poverty rates in the United States today are much lower than they were in the 1950s. Too often, though, poor children continue to remain poor into adulthood. Nearly half of all parents in the bottom quintile of family income have children that have family income in the bottom quintile during adulthood.
What accounts for the lack of economic mobility for America’s poor? Recently released research focuses on the role of colleges—ranking the ability of colleges to promote economic ability for graduates. Geography appears to be a contributing factor as well. Although education and geography no doubt are important factors, what else might explain differences in economic opportunity—particularly on a state-by-state level? Could growth in occupational licensing be playing a nefarious role?
What is occupational licensing? In short, occupational licensing laws require individuals to obtain a government permission slip to work. To obtain this permission slip, prospective workers must meet a variety of requirements such as completing minimum levels of education and training, passing exams, and paying fees. A landmark study, License to Work, published by the Institute for Justice, documents licensing requirements for a subset of 102 low- and moderate-income occupations. Occupations such as barbers, cosmetologists, and emergency medical technicians (EMTs) require licensing in all 50 states and the District of Columbia. Massage therapists and veterinary technologists require licensing in most states. Shampooers and interior designers are licensed in just a handful of states.
In the 1950s, less than 5% of workers were required to obtain a license to work. In 2016, that figure rose to more than 22%.
What this means is that it is effectively much less costly to enter and begin working in an occupation in some states than it is in others. We know that nationally the percentage of workers with occupational licenses has grown tremendously in the last several decades. We also know that the percentage of workers directly affected by occupational licensing varies tremendously from state to state. The percentage of licensed workers in each state varies from as little as 12.4% in South Carolina to as high as 33.3% in Iowa.
What we don’t know is how the number of licensed occupations has changed on a state-by-state basis.
In this paper, we will:
- Provide state-by-state estimates of the growth in the number of low- to moderate-income occupations in the United States.
- Provide correlations of state growth in the number of low- to moderate-income occupations in the United States with an estimate of absolute upward income mobility.
Our results suggest that:
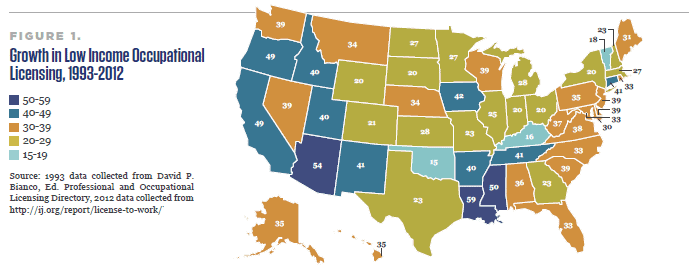
- Growth in the number of low- to moderate-income occupations from 1993 to 2012 ranges from 15 newly licensed occupations in Oklahoma to 59 newly licensed occupations in Louisiana.
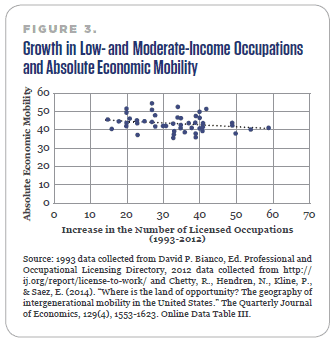
- The correlation between growth in the number of low- to moderate-income occupations and absolute economic mobility is -0.24 suggesting that there is some evidence of a negative association between the growth of licensing restrictions and economic opportunity.
Our paper is organized as follows:
After presenting a brief review of our understanding of the effects of occupational licensing, we will turn to a discussion of our data and methodology before turning to our results.
Occupational Licensing And Its Effects
In recent years, policymakers have been devoting more attention to occupational licensing. A white paper released by the Obama administration documents the costs and benefits associated with occupational licensing and suggests a number of reforms, including that states should use less-restrictive forms of regulation such as certification and bonding. The Institute for Justice introduced an “inverted pyramid” providing policymakers with six distinct regulatory alternatives to occupational licensing that would not impose the same costs on society. What are the costs associated with occupational licensing?
For consumers, occupational licensing is associated with price increases and reduced access to services. The review published by the Obama administration suggests that occupational licensing (primarily in the health sector) increases prices for consumers by between 3 and 16%. An earlier comparison also focusing primarily on health occupations finds similar results. The price effects of occupational licensing are not limited to health professions, however. A study estimating the effects of licensing of cosmetologists finds that stricter licensing is associated with a 19% increase in prices and a 14% reduction in beauty shop visits. Increases in prices may result in consumers not being able to afford access to services—what has come to be referred to as the Cadillac effect. As noted by Milton Friedman “would it not be … absurd if the automobile industry were to argue that no one should drive a low quality car and therefore that no automobile manufacturer should be permitted to produce a car that did not come up to the Cadillac standard.”
The argument that occupational licensing increases quality does not have a great deal of empirical support. Current evidence that licensing enhances the quality of service to consumers is mixed at best. In some cases, it is not clear if the entry requirements are necessary to enhance quality. In the case of hair braiding, for example, the training required to obtain a cosmetologist license generally contains little to no training on hair braiding. Research suggests that licensing boards may tweak entry requirements in response to the size of the pool of potential applicants as opposed to making sure that licensing standards properly protect the public.
Another recent analysis of state-level occupational licensing of private security guards casts doubt on the public safety motive for licensing. This analysis found that increases in occupational licensing requirements for private security guards limited the number of entering firms and existing participants in this industry. Subsequently, this reduction in private security guard firms attributed to the stricter entry barriers was also correlated with increases in state-level burglary, larceny, robbery, and overall property crime rates.
For aspiring workers, occupational licensing may serve as a barrier to entry. In many instances, occupational licensing laws will contain “grandfather” provisions that allow existing practitioners to avoid completing the requirements for licensure. In 2013, Alabama became the fiftieth state to require barbers to obtain a license. Existing barbers could obtain exemption from the law by paying an initial fee of $15 and a renewal fee of $80 every two years. As a result of the new law, aspiring barbers are required to complete either 1,000 hours of training or complete 2,000 hours of apprenticeship in addition to mandatory fees. These costly requirements and fees may discourage individuals from entering the barbering profession. If the public’s safety is the top priority of the licensing law, why exclude existing practitioners from meeting the minimum threshold for quality assurance? Are policymakers properly weighing the costs and benefits of occupational licensing laws as the previous and current presidential administrations have suggested?
Occupational Licensing As A Barrier To Economic Mobility?
Because the requirements of occupational licensing may discourage prospective workers from entering a licensed profession, licensing may be contributing to the inability of low-income workers to achieve the American Dream. The Institute for Justice publication License to Work contains a snapshot of occupational licensing requirements for 102 low- and moderate-level income occupations across the United States in 2012.
Using the publication Professional and Occupational Licensing Directory, we have produced a new data set providing a snapshot of the number of low- and moderate-level income jobs that were licensed in 1993—matching up with the 102 occupations documented in License to Work. The occupations listed in the License to Work publication provide a starting point for the analysis, by isolating growth in licensing of low- and moderate-income occupations. People pursuing these occupations are more likely to be those entering or attempting to climb the income ladder. The successes and failures of these efforts can be captured using a measure of absolute income mobility.
Figure 1 shows the growth of licensing for these low-income occupations during the 1993 through 2012 period. As indicated by this map, growth in occupations licensed ranged from 15 in Oklahoma to 59 in Louisiana. This large variation in growth provides an opportunity to examine how these vast differences in state licensing practices correlate with labor force upward mobility in each state. If the growth of licensing does not allow individuals to enter and move from occupation to occupation it could inhibit income mobility, and thus, increases in licensing would be negatively correlated with absolute mobility measures.
Licensing Changes And Upward Mobility
A measure of intergenerational mobility estimated by Chetty et al. (2014) aims to identify the absolute upward income mobility of different age cohorts across counties in the United States. As stated in Chetty et al. these estimates “calculate the expected rank of children from families at any given percentile p of the national parent income distribution. We call this measure absolute mobility at percentile p. Measuring absolute mobility is valuable because increases in relative mobility have ambiguous normative implications, as they may be driven by worse outcomes for the rich rather than better outcomes for the poor.”
In particular, this estimate measures the expected rank of children in each county in the middle of the lower half of the income distribution, in other words, families at the 25th percentile of the income distribution. In each county, this estimate captures the expected (average) income rank of a child whose parents are at the 25th percentile of the income distribution. The 25th percentile of the income distribution was selected as the primary measure of interest in the Chetty et al. paper, and is of interest to this analysis, because it captures the chances of an individual raised in a relatively low-income family of moving up the income distribution relative to their family circumstances. As such, the estimate is centered on the absolute income mobility of the offspring of low- or moderate-income families. This matches up with our licensing growth statistics that are also focused on low- and moderate-income occupations.
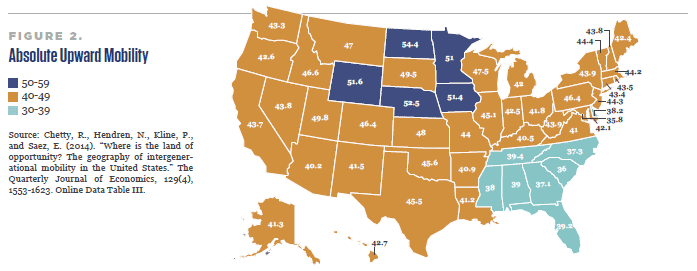
Our analysis presents a first look at how changes in the number of low- and moderate-income licensed occupations compares to upward mobility across states. The data gathered from the Chetty et al. study are county level and were estimated using 1980–82 birth cohorts — the latest birth cohorts used in the study. For the purposes of our analysis, the state-level statistics illustrated in Figure 2 were calculated by averaging the county-level statistics provided for each state. Similar to Figure 1, we can see notable differences across states with respect to absolute income mobility. Estimates range from as low as 35.8 in Delaware to as high as 54.4 in North Dakota. These measures represent the expected national income distribution rank of children born into families at the 25th percentile income distribution, in each of these states. For example, the statistics suggest that a child born to a family in the 25th percentile of the national income distribution in Delaware is projected to be in the 35.8th percentile as an adult.
To explore a possible relationship between average upward mobility and growth in occupational licensing, we computed correlations of growth in low- and moderate-income licensed occupations with absolute income mobility. We computed a correlation coefficient of -0.24, and this is consistent with a possible negative relationship between growth in occupational licensing and reductions in income mobility. We also computed the correlation after weighting each county-level observation by the population sampled in each county and then averaging these estimates across the state. Once more, our estimate of the correlation was negative (-0.202) and this provides further evidence of a possible negative relationship between licensing growth and upward income mobility. Figure 3 presents a plot of absolute economic mobility (on the y-axis) and the growth in the number of licensed occupations (on the x-axis) in each state and the District of Columbia. We computed a simple linear trend line and this provides further evidence of a possible negative relationship between growth in licensed occupations and economic mobility.
Limitations, Analysis, And Conclusions
Although the analysis presented here provides evidence of a possible connection between growth in licensed occupations and economic mobility, there is more work to be done. First, our analysis does not account for many other state-level characteristics that could drive the negative correlation between income mobility and occupational licensing. More sophisticated analysis (such as regression analysis) can be used to control for state-level differences that may also be related to economic mobility. We will be producing a follow-up study performing analysis like this in future months. Second, our analysis does not account for the stringency of licensing requirements. The fact that a state requires a license to enter a profession does not necessarily mean the requirements for that licensure will be onerous. Unfortunately, tracking these details of occupational licensing requirements over time across states is very difficult. Future analysis will ideally be able to identify how much of this documented growth in licensing was also met by increasing barriers to entry in these professions and other previously licensed occupations.
Our analysis does present evidence of a suggestive relationship between the growth in state-level occupational licensing and the fall in absolute upward mobility for relatively low-income families. If this evidence continues to be confirmed by future analysis, it is yet another cost of occupational licensing. Economic theory typically identifies barriers to entry as a major cause for concern in creating economic rents and reduced competition. These barriers result in increases in prices, which is harmful to consumers, as well as restrictions on potential competition from entering the market.
This analysis suggests another cost, that of reductions in income mobility. The negative correlation between the growth of licensing and absolute upward income mobility could be the result of increased licensing hurting the most vulnerable Americans — low and moderate-income families. As these individuals attempt to enter an occupation and try to begin their shot at achieving the American dream, they are finding arbitrary barriers in their way — arbitrary barriers that have gotten steeper over time. These additional costs are the barriers to mobility imposed by occupational licensing requirements. If policymakers are worried about rising income inequality perhaps they should take a careful look at occupational licensing laws. These laws may be limiting the opportunity set of possible occupations available to Americans and converting opportunities into dead ends.
Edward Timmons, Associate Professor of Economics and Director of the Knee Center for the Study of Occupational Regulation at St. Francis University, writes frequently on the history and rise of occupational licensing and it’s relation to economic mobility.
